Statistics of use
Track your performance indicators
Follow the state of use of your spaces continuously
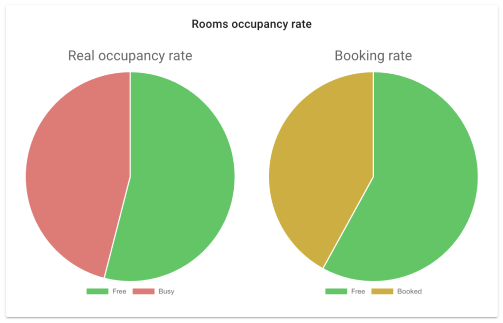
Visualize in real time the occupancy and reservation rates of your meeting rooms and your desks.
Allow your users to quickly identify the buildings and floors where there are free seats
Benefit from our Powerbi dashboards templates
Measure the real occupation of your spaces (workstation, meeting room, box, etc.) to adapt them to the uses and needs of your organization.
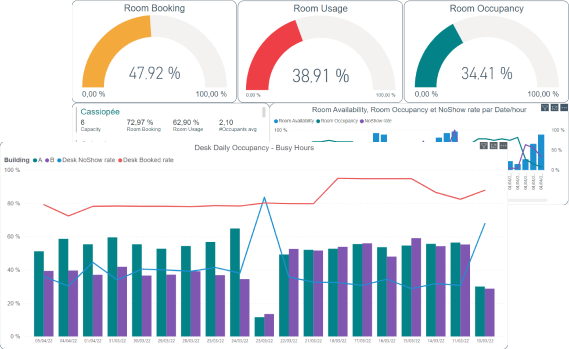
Use our PowerBi reports to facilitate monitoring of your performance indicators.
Define Your Analysis Criteria
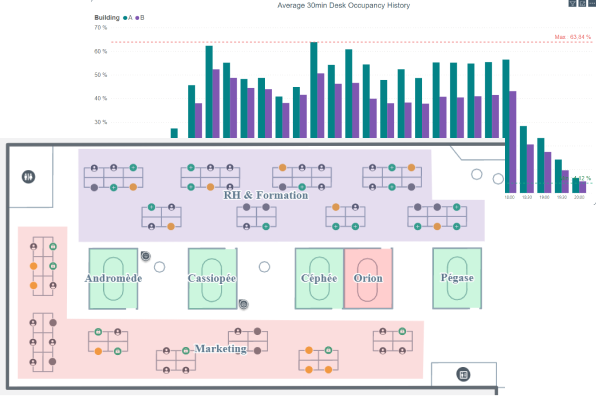
Define your analysis zones according to the distribution of your teams or any other criterion specific to your organization.
Visualize the occupation and reservation metrics for each area and each room over time.
Identify areas under tensions and optimization opportunities to adapt your spaces precisely to the needs of the teams.
Explore data with your own analysis tools
If you are not using PowerBI, collect our anonymized data in raw format through our APIs and analyze them in using your internal analysis tools.

Example of use cases: measure No-Show rates
The No-Show corresponds to reservations not taken. A classic case of No-Show: an employee reserves a place all week “just in case” but finally, only comes for a few days.
This No-Show ratio is measured for desks, meeting rooms, etc.
When the case arises, a two -step optimization mechanism is set up :
1 ) a first notification to the user to confirm or not his reservation;
2 ) A second automatic release process, if the user has not answered the first notification.